Last update: 12/7/2018
California Institute of Technology Website
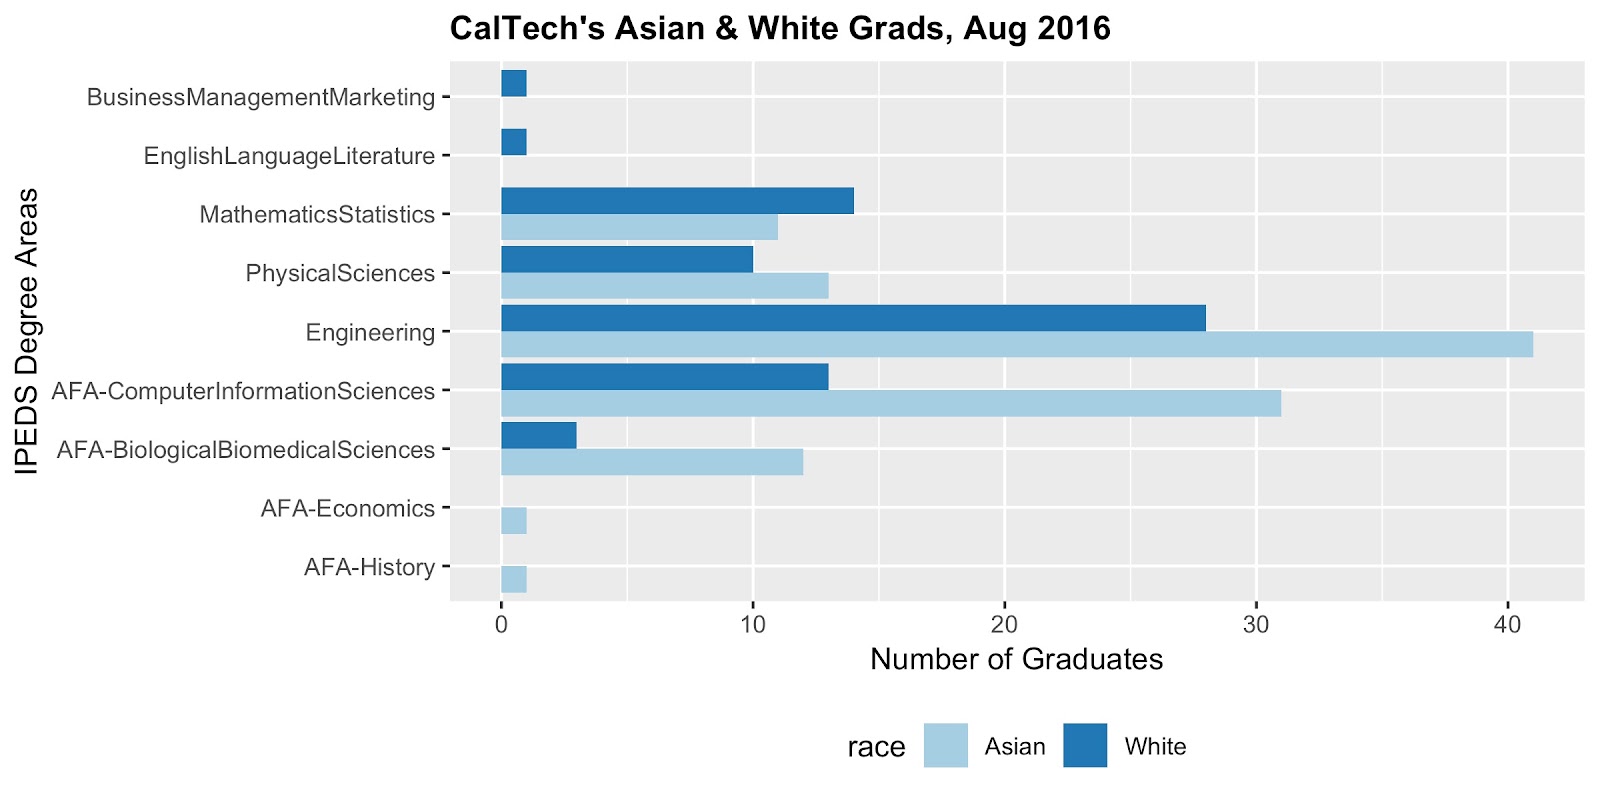
Cal Tech Exhibit 1. Asian American and White Graduates by IPEDS Degree Areas
As per Harvard and M.I.T.'s Exhibit 1, the chart in Cal Tech's Exhibit 1 shows the total number of White and Asian graduates for the Class of 2016. Once again, blue bars show the number of White graduates taking degrees in each IPEDS category; the light-blue bars show the number of Asian graduates. The exact numbers in each category will be shown in Cal Tech's Exhibit 3.

Key points:
Cal Tech Exhibit 2. Asian Focus Areas Identified by Overall Asian-to-White Ratio

Key points:
Cal Tech Exhibit 3A. Graduates -- All Races
The table in Exhibit 3 displays the number of students in each racial category for each of Cal Tech's 9 degree areas. The right-most column displays the ratio of the number in the Asian column to the number in the White column for each category. The last three rows of the table show the total number of students in the Asian Focus areas, the total number in all areas, and the percentage of students in the Asian Focus Areas, respectively.
As per Harvard and M.I.T.'s Exhibit 1, the chart in Cal Tech's Exhibit 1 shows the total number of White and Asian graduates for the Class of 2016. Once again, blue bars show the number of White graduates taking degrees in each IPEDS category; the light-blue bars show the number of Asian graduates. The exact numbers in each category will be shown in Cal Tech's Exhibit 3.
Key points:
- As at Harvard and M.I.T., "ComputerInformationSciences" and "BiologicalBiomedicalSciences" were strong Asian Focus Areas at Cal Tech. Correction: they were stronger than any focus area at the other 20 institutions covered by this report.
- The criterion for defining Asian Focus Areas implicitly assumed that White graduates would greatly outnumber Asian Graduates. Unfortunately, the criterion broke down in silly ways at Cal Tech because Cal Tech was the only institution wherein Asian American graduates outnumbered White graduates by a wide margin. Categories like "Mathematics Statistics", "Physical Sciences", and "Engineering" that were in the Asian Focus Areas at most of the other institutions discussed in this report had Asian-to-White ratios greater than 1.0 at Cal Tech; nevertheless they didn't make the cut. This point is concisely conveyed by the chart in Exhibit 2. ... :-(
Cal Tech Exhibit 2. Asian Focus Areas Identified by Overall Asian-to-White Ratio

Key points:
- The overall Asian-to-White ratio in the graduating class = 1.57, the value displayed by the dotted red line.
- The chart shows that the Asian-to-White ratios for "Computer Information Sciences" and "Biological Biomedical Sciences" are much greater than 1.57, so these categories are very strong AFAs.
- By contrast the chart also shows that the ratios for "Physical Sciences" and "Engineering" are greater than 1.0, but less than 1.57; so these areas are not AFAs, strictly speaking.
- "Business Management Marketing" and "English Language Literature" are well outside Cal Tech's AFAs because zero Asian students took degrees in those areas
Cal Tech Exhibit 3A. Graduates -- All Races
The table in Exhibit 3 displays the number of students in each racial category for each of Cal Tech's 9 degree areas. The right-most column displays the ratio of the number in the Asian column to the number in the White column for each category. The last three rows of the table show the total number of students in the Asian Focus areas, the total number in all areas, and the percentage of students in the Asian Focus Areas, respectively.
| DegreeAreas | All | White | Asian | Hispanic | Black | A2W |
|---|---|---|---|---|---|---|
| EnglishLanguageLiterature | 1 | 1 | 0 | 0 | 0 | 0.00 |
| BusinessManagementMarketing | 1 | 1 | 0 | 0 | 0 | 0.00 |
| MathematicsStatistics | 35 | 14 | 11 | 6 | 2 | 0.79 |
| PhysicalSciences | 44 | 10 | 13 | 5 | 0 | 1.30 |
| Engineering | 92 | 28 | 41 | 10 | 1 | 1.46 |
| AFA-ComputerInformationSciences | 56 | 13 | 31 | 3 | 2 | 2.38 |
| AFA-BiologicalBiomedicalSciences | 18 | 3 | 12 | 2 | 0 | 4.00 |
| AFA-History | 1 | 0 | 1 | 0 | 0 | Inf |
| AFA-Economics | 1 | 0 | 1 | 0 | 0 | Inf |
| ...SumClassOf2016... | 249 | 70 | 110 | 26 | 5 | 1.57 |
| ...PercentClassOf2016... | 100 | 28 | 44 | 10 | 2 | 1.57 |
| ...SumAsianFocusAreas... | 76 | 16 | 45 | 5 | 2 | 2.81 |
| ...PercentAsianFocus... | 31 | 23 | 41 | 19 | 40 | 1.78 |
Key points:
- Exactly one Asian student and no White students took degrees in "Economics" and "History", thereby yielding 1/0 = infinite Asian-to-White ratios for those areas, thereby making "Economics" and "History" Asian Focus Areas. Nonsense. One student is, at best, an anecdote, not a focus.
- Nevertheless, all silliness aside, the numbers and percentages displayed in Exhibits 1 , 2, and 3 should should convince the reader that Cal Tech is an academic haven for most Asian students. It is one of the two institutions covered by this report wherein it might be reasonable to assume that there really is only one pool of qualified applicants, M.I.T. being the other.
- That Asian graduates outnumbered White graduates at Cal Tech is not surprising given its location in California which has one of the largest Asian populations in the U.S. However a more important pair of factors is Cal Tech's small size and its very high 770 score for the 25th percentile on the math SAT (and, presumably, on other objective measures requiring similar skills.)
- A recent study by the Brookings Institute reported that for the Class of 2019, "We estimate that in the entire country last year at most 2,200 black and 4,900 Latino test-takers scored above a 700. In comparison, roughly 48,000 whites and 52,800 Asians scored that high. The same absolute disparity persists among the highest scorers: 16,000 whites and 29,570 Asians scored above a 750, compared to only at most 1,000 blacks and 2,400 Latinos."
Cal Tech Exhibit 3B. Graduates -- -- Other Components
Abbreviated column headings have the usual meanings:
- The "Others" category includes AmericanIndians/AlaskaNatives and NativeHawaiians/Other Pacific Islanders
- "TwoOrMore" = multiracial students
- "Unknown" = students who did not specify any racial group
- "NonResAlien" = non-resident aliens, i.e., foreign students.
| DegreeAreas | All | Others | TwoOrMore | Unknown | NonResAlien |
|---|---|---|---|---|---|
| EnglishLanguageLiterature | 1 | 0 | 0 | 0 | 0 |
| BusinessManagementMarketing | 1 | 0 | 0 | 0 | 0 |
| MathematicsStatistics | 35 | 0 | 0 | 0 | 2 |
| PhysicalSciences | 44 | 0 | 7 | 0 | 9 |
| Engineering | 92 | 1 | 5 | 0 | 6 |
| AFA-ComputerInformationSciences | 56 | 0 | 3 | 0 | 4 |
| AFA-BiologicalBiomedicalSciences | 18 | 0 | 1 | 0 | 0 |
| AFA-History | 1 | 0 | 0 | 0 | 0 |
| AFA-Economics | 1 | 0 | 0 | 0 | 0 |
| ...SumClassOf2016... | 249 | 1 | 16 | 0 | 21 |
| ...PercentClassOf2016... | 100 | 0 | 6 | 0 | 8 |
| ...SumAsianFocusAreas... | 76 | 0 | 4 | 0 | 4 |
| ...PercentAsianFocus... | 31 | 0 | 25 | NaN | 19 |
Key Points:
- The "NAN" in the last row of "Unknown" graduates occurred because there were zero Unknown graduates and zero Unknown graduates in Cal Tech's Asian Focus. So the percentage = 0 / 0 which is not a number, i.e., NAN
No comments:
Post a Comment
Thank you!!! Your comments and suggestions will be greatly appreciated ... :-)