Last update: Monday 1/7/19

In the first decades of New Millennium neoconservatives launched new challenges to affirmative action for Black students, this time on behalf of Asian American applicants rather than White applicants. Their initial target is Harvard University, but the advocates have announced their intention to file charges against Yale University and will probably move on to the rest of the Ivy League and then to other top tier universities that have substantial affirmative action programs, e.g, Stanford University, M.I.T, Duke, Northwestern, etc, etc, etc.
Unlike their conservative predecessors, the neoconservatives concede that the growing numbers of Black, Hispanic, and other minorities who have been admitted to the nation's most renowned colleges and universities were qualified. Their complaint is that the admission of so many qualified minorities has resulted in the unfair rejection of too many qualified Asian applicants. In other words, affirmative action based on race should be prohibited because the benefits it confers on one or more racial groups impose unfair costs on other groups. This report offers an assessment of the neoconservative challenge based on data science.
Executive Summary -- TLDR
The report begins with a brief summary of the challenge of the Asian advocates to Harvard's affirmative action admissions policies; then it suggests a more realistic model than the model underlying the challenge, more realistic in that it better fits the broad scope of Harvard's undergraduate degree programs vs. the surprisingly narrow scope of the degree aspirations of most Asian American applicants.
The report suggests that limits on the expansion of Asian enrollments at Harvard and at other highly selective U.S. universities are increasingly self-imposed. In years past qualified Asian applicants were mostly competing against white applicants, some of whom were the most talented privileged legacies; but in recent years as their enrollments have risen, Asian applicants have also been competing against each other.
- Asian Americans tend to focus on a narrow subset of STEM oriented degree areas offered by most of the 21 top tier colleges and universities covered by this report, including Harvard University.
- In Harvard's case, this self-imposed limitation results in almost 75 percent of Asian American students being in enrolled in seven STEM areas that only account for 50 percent of the university's total enrollment.
- In Harvard's case, this self-limitation means that Asian Americans would only attain a modest 3 percent increase in their share of Harvard's enrollment if Harvard replaced race-conscious admissions with admissions based on financial need while maintaining its other admissions advantages, e.g., for legacies and athletes.
- This 3 percent increase is much, much lower than the estimated increase provided by the advocates on behalf of the plaintiffs at the first Harvard trial in October/November 2018.
I. The Asian advocates' challenge -- One size fits all
Given that Harvard has never published its admissions criteria, how did the advocates know how many qualified Asian applicants had been unfairly rejected?
- Harvard gave the advocates access to the documents submitted by all applicants for six academic years for the classes of 2014 to 2019 -- the students who started in the Fall 2010 to the Fall 2015 semesters. The advocates hired an economist to develop a statistical model that analyzed the application files for that six year period in an effort to infer Harvard's de facto admissions criteria. When the advocates were satisfied that their model successfully reverse engineered Harvard's criteria, they concluded that Harvard's admissions process was systematically biased against Asian applicants and systematically biased in favor of Black and Hispanic applicants.
- This conclusion was buttressed by their discovery of comments that appeared to have a derogatory tone on the documents in some of the Asian applicants' packages and by the lower personality ratings that many Asian applicants received, personality being one of the four categories on which Harvard bases its admissions decisions.
- Readers should keep in mind that the advocates were only dealing with thousands of applications. Machine learning techniques applied to millions of applications might reliably uncover implicit patterns in complex decision processes; but inferring Harvard's complex admissions decisions from thousands of applications cannot guarantee comparably high levels of reliability. Thus a courtroom "duel" of experts was inevitable.
- According to the Chronicle of Higher Education, the economist hired by the advocates to develop their statistical model testified on 10/25/18 that the model estimated that Asian Americans would have earned more than 40 percent of Harvard's admissions if race had not been a factor. Not surprisingly, the Chronicle subsequently reported that the economist retained by Harvard to assess the advocates' model testified on 10/31/18 that the model was "deeply flawed", because (1) it excluded a substantial segment of Harvard's admissions -- legacies, children of faculty, athletes, etc, and (2) it assigned far more weight to objective measures (e.g., high school grades, scores on SAT exams, AP exams, etc.) and far less weight to non-objective measures and overall assessments than did Harvard's actual admission process.
- This case will probably be appealed all the way up the Supreme Court.
DLL Editor's note: Most of the data subsequently referenced in this report was downloaded from the online IPEDS database maintained by the U.S. Department of Education's National Center for Education Statistics.
II. An alternative perspective -- Of apples, oranges, peaches, pears, papayas, and avocados
Question: Harvard's admissions office assigns numerical scores to the applications that it receives in four categories: academic ability, athletic ability, extracurricular activity, and personality. Which category has the greatest impact on an applicant's admission or rejection?
Author's response: None of the above. The most important category is the area of study that an applicant intends to pursue if admitted. Applicants provide numerous indications of their interests in their application materials. An applicant's intended area of study determines the specific subset of Harvard's admissions criteria that its admissions office will apply when evaluating the applicant's materials. Contrary to the advocate's "one size fits all" model, Asian applicants who intend to pursue degrees related to one pool of qualified applicants are not compared with Black or Hispanic or White applicants in other pools of qualified applicants
One of the fundamental tenets of data science is its recognition of the importance of thoroughly exploring one's data before selecting models for the data and appropriate statistical and/or computational procedures for analyzing the behavior of the models. The advocates assumed that there was only one pool of qualified applicants so that only one set of admissions criteria should have been imposed on all applicants. Therefore Asian applicants who had been rejected, but deemed qualified by their version of Harvard's admission criteria could be compared to all Black and Hispanic and White applicants who had been admitted.
Nevertheless, publicly available data from Harvard's Website and from the U.S. Department of Education's IPEDS database strongly suggests that Harvard's admission office manages not one, but multiple application pools that have widely varying admissions requirements:
- Harvard University, like other highly selective comprehensive universities, offers a wide range of bachelors degree programs that Harvard calls "concentrations". An entering class must therefore include students who embody a correspondingly diverse range of aptitudes, prior knowledge, and ambitions, so that year after year the admissions process will yield candidates who will be successful in all of the university's various degree programs.
- For example, a student's ability to achieve a perfect 800 score on the math SAT exam might be a strong indicator of success for some concentrations; whereas the highest level mastery of mathematical fundamentals might be far less relevant for other concentrations ==> 600 to 650 scores might be sufficient. Harvard's admissions office must apply different criteria to its different application pools.
- IPEDS identifies about 40 areas of study for which U.S. colleges and universities offer bachelors degree programs. This report will present data about the degrees obtained by Asian students from Harvard and 20 other top tier institutions, including all members of the Ivy League. It will be shown that most of these institutions offer degrees in at least 16 IPEDs degree areas. As consequence, their admissions offices are not just looking for apples and oranges; they are also in the market for peaches, pears, papayas, and avocados. Nevertheless, this report also shows that at most of these institutions most Asian students earned degrees in only six or seven areas.
- This narrow focus means that Asian Americans are not just competing against applicants from other races, including highly talented, privileged White legacies. As the number of Asian applicants increases, the number of admissions slots in Asian applicants' preferred areas of study will remain more or less the same. So they the larger numbers of Asian applicants are increasingly in competition with each other. Indeed, readers should bear in mind that admissions offices not only strive to manage a steady flow of students into all of the programs offered by their institutions, they must do so within a context of de facto upper limits on the size of their entering classes. For example, Harvard rarely (never?) admits a freshman class larger than 2,000. Faced with a steady 2 or 3 percent increase in the number of applications to programs in six or seven of its degree areas, it is more likely to increase its rejection rate by 2 or 3 percent than increase its acceptance rate by 2 or 3 percent.
III. Methods
Three methodological questions must be addressed before the report's findings can be discussed.
Question #1: Why were these particular 21 institutions included in this study?
Answer #1: Given the possibility that the advocates' challenge to Harvard's admissions might ultimately result in a Supreme Court decision to ban affirmative action everywhere, the author conducted a preparatory study that identified the institutions upon which this prohibition would have the greatest impact.
To be specific, the author used IPEDS data to identify what he called the "Black 6-year 75 percent 50 Group". This group of institutions included colleges that had managed to graduate 75 percent of the Black students they had admitted on a first-time, full-time basis in the Fall 2015 semester, and graduated them by August 2016, six years later. In other words, the 6-year graduation rates for the Black students at these institutions were at least 75 percent. The "50" in the group's name refers to an additional condition: these institutions had to graduate at least 50 Black students in their 6-year cohort. Readers should note that the colleges and universities that graduated at least 50 Black students in six years included most of the nation’s most selective colleges and universities.
Although each of the 55 institutions in the group was selective, the author also identified a subset of 20 institutions that were highly selective. Reflecting the author's long-standing interest in the relatively low participation of Black Americans in STEM fields, the criterion he used to identify the highly selective subset of the original group was a 670 value for the 25th percentile score on math SAT exams. In other words, 75 percent of all of the students admitted by these institutions on a first-time, full-time basis in the Fall 2015 semester achieved math SAT scores that were at least 670. Given that the Asian advocates had signaled their intention to file lawsuits against Yale and then against other members of the Ivy League, the author designated 670 as the cutoff because it was the greatest lower bound, i.e., the highest score that would allow all eight members of the Ivy League to be included in the subset.
Note: The California Institute of Technology was added to the current study as a "control group" for reasons that will be discussed in the "Findings" section of this report.
Note: IPEDS data for students entering in the Fall 2015 semester was chosen because of it was the most recent class included in the data provided to the Asian advocates.
Question #2: Which IPEDS degrees are "Asian Focus Areas"?
Answer #2: The Asian advocates had access to Harvard's application packages; the author did not. So he did the next best thing by examining IPEDS data about the degrees that Asian students who graduated in the Spring 2016 semester. Of course some entering freshmen might change majors by the time they became seniors; but the author reasoned that most changes would be from their initial area of interest upon entry to other areas that required similar aptitudes and prior knowledge. For example, some students might switch from sociology to anthropology, or from theoretical physics to pure math.
The proportion of Asian American seniors in the Class of 2016 who obtained degrees in various areas will be used to provide plausible estimates of proportions of Asian American freshmen in the Class of 2019 who intended to pursue academic programs leading to degrees in those same areas.
(Note: Readers can verify that the relative proportions of the racial groups in the Class of 2016 were about the same as their relative proportions in the Class of 2019 by comparing the table of enrollments for all 21 institutions, found at this link, with the table of graduates from all institutions that appears in the Findings section of this report. The enrollment table also displays the math SAT 25th percentile score for each institution.)
The U.S. Department of Education requires that all accredited U.S. colleges and universities submit data about their graduates, classified by degree areas and by racial/ethnic groupings every year. Its IPEDS database identifies about 40 top level degree areas, but each top level area has sub levels, and some sub levels have sub sub levels. Most of the 21 colleges and universities covered by this report offered bachelors degrees in at least 16 IPEDS degree areas.
- White students have constituted the largest component of the enrollments in most highly selective institutions since their inception; by contrast Asian Americans and other minorities have only been enrolled in substantial numbers since the Supreme Court's landmark Brown vs. Board of Education desegregation decision in 1954. White students obtain degrees in all areas; they were the "founding students" in most departments; so they are the natural comparison group for judging whether Asian students do or do not focus on limited subsets of the degree options available at an institution.
- The author adopted a straight-forward measure of focus. Given the overall Asian-to-White ratio of students in an institution's graduating class, all other things being equal, one would expect to find the same ratio -- more or less -- within each of the degree areas offered by that institution.
- For example, if there were 1,000 White students in the graduating class and 200 Asian students, one would expect to find that the number of Asian graduates in Computer Science would be 200/1000 = 1/5th the number of White graduates in Computer Science -- more or less. If the Asian-to-White ratio in a degree area was higher than the overall ratio for the entire class, that area would be designated as an "Asian Focus Area".
- If the Asian-to-White ratio in a degree area was much higher than the overall Asian-to-White ratio for the entire graduating class, that area would be a strong focus; if the ratio in an area was close to the overall ratio, that area would be a weak focus; and if it was the same or less than the overall ratio, it would not be a focus area. Of course, weak focus areas could be statistical flukes, reflecting random fluctuations in the composition of a graduating class and its distribution of selected majors from one year to the next.
- Only top level IPEDS degree areas were used in this study -- with two exceptions. The IPEDS top level "Social Sciences" area was disaggregated into "Economics", "Political Science", and "Social Sciences without Economics and Political Science". In some highly selective institutions Economics and Political Science courses make more extensive use of calculus, matrices, and other advanced mathematics than other social sciences. Prior preparation in these areas would make applicants more attractive to these programs.
Question #3: Why analyze data from 21 institutions? Why not just focus on Harvard, the defendant in the current case?
Answer #3: One way to resolve the "more or less" statistical uncertainties mentioned in the definition of an "Asian Focus Area" would be to examine data from more than one graduating class at Harvard, better still, to analyze the data from a series of classes. But the possibility would still remain that Asian students only focused (or didn't focus) at Harvard ... but not at the other highly selective institutions. By choosing to conduct a cross sectional exploration of the behavior of Asian American students at 21 institutions, the author finessed statistical flukes and atypical behaviors.
IV. Findings
This section begins with a discussion of the narrow focus of Asian American students at Harvard University. Then it presents exhibits, i.e., tables and charts, that provide an overview of the narrow focus of Asian students at 19 other institutions.
Note: Links to exhibits that provide detailed documentation of the narrow Asian focus at each of the 21 highly selective U.S. colleges and universities covered by this report are included in Appendix #1.
The overview is followed by a discussion of M.I.T.'s graduates. M.I.T. is Harvard's neighbor and high end competitor in Cambridge, MA. It also implements affirmative action admissions policies; but its 750 math SAT 25th percentile is much higher than Harvard's 700. M.I.T. offers a narrower range of programs than Harvard. Indeed, M.I.T. is one of two institutions considered in this study wherein it might be plausible to assume that there is only one pool of qualified applicants. Nevertheless the similarities between its programs and the programs in Harvard's Asian Focus Areas will make it a useful benchmark for assessing the credibility of Harvard's admissions policies in those areas.
Discussion of M.I.T.'s profile is followed by a detailed analysis of Cal Tech, whose 770 math 25th percentile is the highest in the nation. Its small size, lack of race-based affirmative action policies (as evidenced by the fact that only 1 percent of its students are Black Americans), and narrow range of degree options provides an ideal context for the narrow focus of most Asian American applicants. CalTech is the other institution considered in this study wherein it is might be plausible to assume that there is only one pool of qualified applicants.
The Findings conclude with an estimate of the increase in the Asian American share of Harvard's enrollments assuming that affirmative action is discontinued, but all of the other factors that Harvard considers in its admissions decisions remain in place.
A. Harvard University
Relevant data for Harvard and for all other institutions are presented in tables and charts featured in three exhibits per institution. The following exhibits describe Harvard's Asian Focus Areas and their relative importance to Harvard's White and Asian American graduates.
- The "AFA" prefix in front of the names of the seven degree areas listed at the bottom of the vertical axis designates these areas as Asian Focus Areas.

Key points:
- Harvard offered programs in 18 IPEDS degree areas
- Seven of these 18 areas were Asian Focus Areas, the five will subsequently be shown to be the most favored by all 21 institutions -- "Computer Information Sciences", "Biological Biomedical Sciences", "Mathematics Statistics", "Engineering", and "Economics" ... plus "Physical Sciences" and "Natural Resources Conservation".
- Asian graduates only outnumbered White graduates in "Computer Information Sciences"
Harvard Exhibit 2. Asian Focus Areas Identified by Overall Asian-to-White Ratios
The chart shown in Exhibit 2 displays the Asian-to-White ratios in all IPEDs categories plus a dashed red line the marks the 0.42 overall ratio of Asian to White students in the graduating class. Bars that end to the right of the dotted line are Asian Focus Areas; bars that end to the left of the line are not.

Key points:
- "Computer Information Sciences" was, by far, Harvard's strongest Asian Focus Area; but it did not have the largest number of Asian graduates. As will be seen from the next table, BiologicalBiomedicalSciences yielded the largest number of Asian graduates.
Harvard Exhibit 3A. Graduates -- All Races
The table in Exhibit 3 displays the number of students in each racial category for each of Harvard's 18 degree areas.
- A2W, the right-most column, displays the ratio of the number of students in the Asian column to the number in the White column for each category.
- The last four rows of the table show the total enrollments, total number of students in Asian Focus areas, percentage of total enrollments, the total number in Asian Focus Areas, and the percentage of enrollments in Asian Focus Areas, respectively.
| DegreeAreas | All | White | Asian | Hispanic | Black | A2W |
|---|---|---|---|---|---|---|
| PhilosophyReligiousStudies | 15 | 9 | 0 | 3 | 0 | 0.00 |
| AreaEthnicCulturalGenderGroup | 34 | 20 | 1 | 3 | 2 | 0.05 |
| MultiInterdisciplinaryStudies | 32 | 18 | 2 | 3 | 1 | 0.11 |
| LiberalArtsSciencesGeneralStudies | 30 | 17 | 2 | 3 | 2 | 0.12 |
| ForeignLanguagesLiteraturesLinguistics | 44 | 24 | 3 | 9 | 2 | 0.12 |
| EnglishLanguageLiterature | 58 | 39 | 5 | 8 | 0 | 0.13 |
| PoliticalScience | 136 | 75 | 11 | 17 | 8 | 0.15 |
| History | 132 | 86 | 15 | 11 | 5 | 0.17 |
| SocialSciencesWithoutEconPoli | 243 | 117 | 33 | 27 | 20 | 0.28 |
| Psychology | 101 | 48 | 16 | 11 | 9 | 0.33 |
| VisualPerformingArts | 49 | 22 | 9 | 2 | 3 | 0.41 |
| AFA-Economics | 218 | 93 | 44 | 18 | 11 | 0.47 |
| AFA-Engineering | 77 | 35 | 17 | 7 | 8 | 0.49 |
| AFA-PhysicalSciences | 89 | 38 | 23 | 3 | 3 | 0.61 |
| AFA-NaturalResourcesConservation | 12 | 6 | 4 | 0 | 2 | 0.67 |
| AFA-MathematicsStatistics | 182 | 82 | 57 | 6 | 7 | 0.70 |
| AFA-BiologicalBiomedicalSciences | 254 | 87 | 71 | 28 | 26 | 0.82 |
| AFA-ComputerInformationSciences | 104 | 27 | 44 | 6 | 2 | 1.63 |
| ...SumClassOf2016... | 1810 | 843 | 357 | 165 | 111 | 0.42 |
| ...PercentClassOf2016... | 100 | 47 | 20 | 9 | 6 | 0.42 |
| ...SumAsianFocusAreas... | 936 | 368 | 260 | 68 | 59 | 0.71 |
| ...PercentAsianFocus... | 52 | 44 | 73 | 41 | 53 | 1.66 |
Key points:
- The right most column for the "...SumAllDegreeAreas..." row shows that the ratio of the total number of Asian graduates to the total number of White graduates = 352/695 = 0.51, the defining ratio for the Asian Focus Areas shown in Exhibit 2.
- As per the bottom line of the table, 73 percent of the Asian American graduates obtained degrees from programs within Harvard's seven Asian Focus Areas. By contrast, only 44 percent of the White graduates obtained degrees in those areas; 56 percent obtained their degrees from programs outside the Asian Focus Areas.
- The "...SumAsianFocusAreas..." line shows that only 68 of Harvard's 165 Hispanic American graduates obtained degrees within Asian Focus Areas, which mean that 97 obtained their degrees from programs outside the focus areas. In other words, they were admitted from a different pool of qualified applicants
- The "...SumAsianFocusAreas..." line also shows that only 59 of Harvard's 111 Black American graduates obtained degrees within Asian Focus Areas, which means]t that 52 obtained their degrees from programs outside the focus areas. Once again, they were admitted from a different pool of qualified applicants.
Harvard Exhibit 3B. Graduates -- Other Components
Abbreviated column headings have the following meanings:
- The "Others" category includes AmericanIndians/AlaskaNatives and NativeHawaiians/Other Pacific Islanders
- "TwoOrMore" = multiracial students
- "Unknown" = students who did not specify any racial group
- "NonResAlien" = non-resident aliens, i.e., foreign students
| DegreeAreas | All | Others | TwoOrMore | Unknown | NonResAlien |
|---|---|---|---|---|---|
| PhilosophyReligiousStudies | 15 | 0 | 1 | 0 | 2 |
| AreaEthnicCulturalGenderGroup | 34 | 0 | 6 | 0 | 2 |
| MultiInterdisciplinaryStudies | 32 | 1 | 0 | 4 | 3 |
| LiberalArtsSciencesGeneralStudies | 30 | 0 | 2 | 2 | 2 |
| ForeignLanguagesLiteraturesLinguistics | 44 | 0 | 2 | 3 | 1 |
| EnglishLanguageLiterature | 58 | 0 | 1 | 0 | 5 |
| PoliticalScience | 136 | 1 | 7 | 3 | 14 |
| History | 132 | 0 | 7 | 2 | 6 |
| SocialSciencesWithoutEconPoli | 243 | 0 | 14 | 8 | 24 |
| Psychology | 101 | 0 | 6 | 1 | 10 |
| VisualPerformingArts | 49 | 0 | 1 | 1 | 11 |
| AFA-Economics | 218 | 0 | 10 | 2 | 40 |
| AFA-Engineering | 77 | 0 | 3 | 0 | 7 |
| AFA-PhysicalSciences | 89 | 0 | 9 | 0 | 13 |
| AFA-NaturalResourcesConservation | 12 | 0 | 0 | 0 | 0 |
| AFA-MathematicsStatistics | 182 | 0 | 6 | 3 | 21 |
| AFA-BiologicalBiomedicalSciences | 254 | 1 | 21 | 5 | 15 |
| AFA-ComputerInformationSciences | 104 | 0 | 9 | 2 | 14 |
| ...SumClassOf2016... | 1810 | 3 | 105 | 36 | 190 |
| ...PercentClassOf2016... | 100 | 0 | 6 | 2 | 10 |
| ...SumAsianFocusAreas... | 936 | 1 | 58 | 12 | 110 |
| ...PercentAsianFocus... | 52 | 33 | 55 | 33 | 58 |
Key points:
- The bottom row shows that most of the multi-racial students and foreign students obtained their degrees from programs in Asian Focus Areas; most of the students of "unknown" racial background obtained degrees outside of Harvard's Asian Focus Areas
- Total enrollments in the "Others" were negligible, only 3 students.
- The last three columns will provide inputs for the analysis of the advocates' challenge to Harvard's admissions in the final section of the Findings.
B. Summary Exhibits that provide overviews of all 21 institutions
Summary Exhibit 1. Asian vs. White Graduates at All 21 Institutions
The chart in Exhibit 7 depicts the percentage of White students obtaining degrees in Asian Focus Areas vs. the percentage of Asian students obtaining degrees in Asian Focus Areas. As before, blue bars show White percentages; light-blue bars depict Asian percentages. The institutions are ordered from top to bottom by the percentage of Asian students obtaining degrees from programs in Asian Focus Areas.

Key points:
- Although the IPEDS degree areas that are designated as Asian Focus Areas may vary a bit from one institution to the next, the light-blue bars are always substantially longer than the blue bars. In other words, the percentage of Asian students obtaining degrees in an institution's Asian Focus Areas is alway substantially larger than the percentage of White students obtaining degrees in those areas.
Summary Exhibit 2. Top 5 AFAs at the 21 institutions
The top five Asian Focus Areas are depicted by the bar chart in Exhibit 8. The bars are annotated with the number of institutions including each area as an Asian Focus Area.

Key points:
- The ubiquity of the top four areas is striking. Every institution included "Biological Biomedical Sciences" -- 21 out of 21. Only three did not include "Computer Information Sciences" -- 18 out of 21 did. And only four did not include "Mathematics Statistics" or "Economics" -- 17 out of 21 did.
Summary Exhibit 3. Graduates at all 21 institutions
The nine columns in the table in Exhibit 3 contain the following information:
- Institution = Name of the college or university
- Total Grads = The total number of graduates
- % White Grads = Percentage of White students in the graduating class
- % Asian Grads = Percentage of Asian students in the graduating class
- Num IPEDS = Number of IPEDS areas each institution in which each institution offered degrees
- Num Focus = Number of each institution's Asian Focus Areas
- % White in Focus = Percent of White students taking degrees in Asian Focus Areas
- % Asian in Focus = Percent of Asian students taking degrees in Asian Focus Areas
The rows are ordered from highest to lowest by the percentages in the Asian Focus Areas, last column
| Institution | Total Grads | % White Grads | % Asian Grads | Num IPEDS | Num Focus | % White In Focus | % Asian In Focus |
|---|---|---|---|---|---|---|---|
| CarnegieM | 1336 | 40 | 27 | 19 | 10 | 64 | 85 |
| Princeton | 1307 | 47 | 22 | 17 | 6 | 57 | 82 |
| Amherst | 432 | 44 | 13 | 18 | 10 | 57 | 80 |
| Yale | 1395 | 45 | 18 | 19 | 9 | 52 | 79 |
| IllinoisUC | 7953 | 52 | 16 | 27 | 10 | 54 | 77 |
| Duke | 1810 | 49 | 20 | 20 | 6 | 41 | 75 |
| Cornell | 3758 | 43 | 17 | 24 | 8 | 44 | 74 |
| Harvard | 1810 | 47 | 20 | 18 | 7 | 44 | 73 |
| Penn | 2927 | 44 | 20 | 23 | 9 | 44 | 71 |
| Dartmouth | 1077 | 50 | 16 | 17 | 6 | 39 | 70 |
| Northwestern | 2328 | 55 | 18 | 23 | 9 | 41 | 70 |
| Stanford | 1746 | 40 | 20 | 19 | 5 | 39 | 68 |
| Rice | 1015 | 38 | 23 | 20 | 7 | 44 | 68 |
| Tufts | 1374 | 55 | 10 | 20 | 8 | 39 | 64 |
| Columbia | 2221 | 40 | 17 | 21 | 6 | 33 | 63 |
| Brown | 1591 | 45 | 11 | 22 | 4 | 29 | 61 |
| MIT | 1111 | 38 | 25 | 16 | 5 | 37 | 60 |
| Washington | 1762 | 54 | 18 | 23 | 6 | 31 | 56 |
| NotreDame | 2135 | 69 | 7 | 22 | 10 | 30 | 54 |
| Vanderbilt | 1723 | 63 | 9 | 20 | 7 | 30 | 52 |
| CalTech | 249 | 28 | 44 | 9 | 4 | 23 | 41 |
Key points:
- Asian graduates were highly focused at all 21 institutions on programs in less than half of the IPEDS degree areas that were offered by these institutions (with the exception of Cal Tech wherein almost all students obtained degrees in areas that at other institutions were designated as Asian Focus Areas).
- The percentage of Asian students obtaining degrees in Asian Focus Areas (last column) is alway greater than 50 percent -- except for the anomalous case of Cal Tech.
C. Massachusetts Institute of Technology (M.I.T.)
This section presents the usual three exhibits that describe M.I.T.'s Asian Focus Areas and their relative importance to M.I.T.'s White and Asian American graduates.
M.I.T. Exhibit 1. Asian and White Graduates by IPEDS Degree Areas
The chart in this exhibit shows the number of Asian and White graduates for programs in each degree area.
- For each degree area, blue bars show White graduates; light blue bars show Asian graduates

Key points:
- The light blue Asian bars for 7 of M.I.T.'s 16 IPEDS areas do not appear because there were only a few Asian graduates in those areas. The exact number of graduates are displayed in the table in the next exhibit.
M.I.T. Exhibit 2. Asian Focus Areas Identified by Overall Asian-to-White Ratio

Key points:
- As in the previous chart, no bars appear for seven of the 16 categories because there were so few Asian graduates in those areas that the A2W ratios were zero or close to zero
- Of M.I.T's 5 Asian Focus Areas, MathematicsStatistics is the strongest, followed by Economics and Architecture. But the table in the next exhibit will show that Economics and Architecture produced small numbers of Asian and White graduates
M.I.T. Exhibit 3A. Graduates -- All Races
Readers should note that the "NAN" entries in the Asian-to-White ratio column (A2W) for EnglishLanguageLiterature and CommunicationJournalism appear because the number of Asian and White graduates in both areas was zero, yielding 0/0 entries, which are not numbers, hence the "NAN" for "not a number" ... :-)
| DegreeAreas | All | White | Asian | Hispanic | Black | A2W |
|---|---|---|---|---|---|---|
| VisualPerformingArts | 2 | 2 | 0 | 0 | 0 | 0.00 |
| SocialSciencesWithoutEconPoli | 1 | 1 | 0 | 0 | 0 | 0.00 |
| PoliticalScience | 1 | 1 | 0 | 0 | 0 | 0.00 |
| LiberalArtsSciencesGeneralStudies | 6 | 2 | 0 | 1 | 2 | 0.00 |
| ForeignLanguagesLiteraturesLinguistics | 2 | 2 | 0 | 0 | 0 | 0.00 |
| BusinessManagementMarketing | 18 | 9 | 2 | 3 | 2 | 0.22 |
| PhysicalSciences | 86 | 34 | 11 | 15 | 5 | 0.32 |
| Engineering | 468 | 194 | 87 | 86 | 32 | 0.45 |
| MultiInterdisciplinaryStudies | 40 | 19 | 11 | 2 | 0 | 0.58 |
| AFA-BiologicalBiomedicalSciences | 89 | 34 | 29 | 8 | 7 | 0.85 |
| AFA-ComputerInformationSciences | 295 | 95 | 102 | 35 | 13 | 1.07 |
| AFA-Architecture | 14 | 4 | 5 | 2 | 0 | 1.25 |
| AFA-Economics | 12 | 3 | 4 | 1 | 1 | 1.33 |
| AFA-MathematicsStatistics | 72 | 19 | 26 | 9 | 0 | 1.37 |
| EnglishLanguageLiterature | 2 | 0 | 0 | 1 | 1 | NaN |
| CommunicationJournalism | 3 | 0 | 0 | 1 | 1 | NaN |
| ...SumClassOf2016... | 1111 | 419 | 277 | 164 | 64 | 0.66 |
| ...PercentClassOf2016... | 100 | 38 | 25 | 15 | 6 | 0.66 |
| ...SumAsianFocusAreas... | 482 | 155 | 166 | 55 | 21 | 1.07 |
| ...PercentAsianFocus... | 43 | 37 | 60 | 34 | 33 | 1.62 |
Key points:
- As per the bottom line of the table, 60 percent of the Asian American graduates obtained degrees from programs within M.I.T's 5 Asian Focus Areas. By contrast, only 37 percent of the White graduates obtained degrees in those areas.
- The bottom line of the table shows that only 34% of M.I.T's Hispanic American graduates obtained degrees within Asian Focus Areas
- Similarly, the bottom line shows that only 33% of Black Americans obtained degrees within Asian Focus Areas
- ComputerInformationSciences, the strongest Asian Focus Area, produced the largest number of Asian graduates, by far, of all of M.I.T.'s 16 degree areas.
- Engineering, the area that produce the largest number of graduates, by far, was not an Asian Focus Group because its A2W ratio, 0.45, though a bit larger than Harvard's defining 0.42 ratio, was well below M.I.T.'s overall 0.62 Asian-to-White ratio.
- Engineering also produced the largest number of Hispanic (86) and Black (32) graduates
- Whereas Asian Focus Areas at Harvard and most other institutions were more STEM oriented than other degree areas, this was not a defining feature at M.I.T.
- The number of graduates in M.I.T.'s Class of 2019 was about the same as the number of graduates in Harvard's Class of 2019 in Harvard's Asian Focus Areas, 1,111 and 936 respectively.
M.I.T. Exhibit 3B. Graduates -- Other Components
Abbreviated column headings have the following meanings:
- The "Others" category includes AmericanIndians/AlaskaNatives and NativeHawaiians/Other Pacific Islanders
- "TwoOrMore" = multiracial students
- "Unknown" = students who did not specify any racial group
- "NonResAlien" = non-resident aliens, i.e., foreign students
| DegreeAreas | All | Others | TwoOrMore | Unknown | NonResAlien |
|---|---|---|---|---|---|
| VisualPerformingArts | 2 | 0 | 0 | 0 | 0 |
| SocialSciencesWithoutEconPoli | 1 | 0 | 0 | 0 | 0 |
| PoliticalScience | 1 | 0 | 0 | 0 | 0 |
| LiberalArtsSciencesGeneralStudies | 6 | 0 | 1 | 0 | 0 |
| ForeignLanguagesLiteraturesLinguistics | 2 | 0 | 0 | 0 | 0 |
| BusinessManagementMarketing | 18 | 0 | 0 | 0 | 2 |
| PhysicalSciences | 86 | 0 | 2 | 1 | 18 |
| Engineering | 468 | 0 | 22 | 8 | 39 |
| MultiInterdisciplinaryStudies | 40 | 0 | 4 | 1 | 3 |
| AFA-BiologicalBiomedicalSciences | 89 | 0 | 4 | 3 | 4 |
| AFA-ComputerInformationSciences | 295 | 0 | 17 | 5 | 28 |
| AFA-Architecture | 14 | NA | NA | NA | NA |
| AFA-Economics | 12 | 0 | 0 | 0 | 3 |
| AFA-MathematicsStatistics | 72 | 0 | 2 | 2 | 14 |
| EnglishLanguageLiterature | 2 | 0 | 0 | 0 | 0 |
| CommunicationJournalism | 3 | NA | 1 | NA | 0 |
| ...SumClassOf2016... | 1111 | 0 | 53 | 20 | 114 |
| ...PercentClassOf2016... | 100 | 0 | 5 | 2 | 10 |
| ...SumAsianFocusAreas... | 482 | NA | NA | NA | NA |
| ...PercentAsianFocus... | 43 | NA | NA | NA | NA |
Key points:
- The last three columns will provide inputs for the analysis of the advocates' challenge to Harvard's admissions in the final section of the Findings.
D. California Institute of Technology (Cal Tech)
Cal Tech was added to the current study because it provides an ideal environment for Asian Americans to pursue their preferred degree options. Cal Tech provides an ideal benchmark for three reasons:
Cal Tech Exhibit 1. Asian American and White Graduates by IPEDS Degree Areas
As per Harvard and M.I.T.'s Exhibit 1, the chart in Cal Tech's Exhibit 1 shows the total number of White and Asian graduates for the Class of 2016. Once again, blue bars show the number of White graduates taking degrees in each IPEDS category; the light-blue bars show the number of Asian graduates. The exact numbers in each category will be shown in Cal Tech's Exhibit 3.

Key points:
Cal Tech Exhibit 2. Asian Focus Areas Identified by Overall Asian-to-White Ratio

Key points:
Cal Tech Exhibit 3A. Graduates -- All Races
The table in Exhibit 3 displays the number of students in each racial category for each of Cal Tech's 9 degree areas. The right-most column displays the ratio of the number in the Asian column to the number in the White column for each category. The last three rows of the table show the total number of students in the Asian Focus areas, the total number in all areas, and the percentage of students in the Asian Focus Areas, respectively.
Cal Tech was added to the current study because it provides an ideal environment for Asian Americans to pursue their preferred degree options. Cal Tech provides an ideal benchmark for three reasons:
- Cal Tech has no race-based admissions policies; instead, as has been recommended to Harvard by some of Harvard's critics, it affords admissions advantages based on financial need.
- Its undergraduate program is very small -- total enrollments about 1,000 students -- small enough for Asian American enrollments to greatly exceed White enrollments.
- It runs what is arguably the nation's most selective undergraduate program, having a math SAT 25th percentile score = 770 for its entering class in Fall 2015, the highest score of all U.S. colleges and universities
Cal Tech Exhibit 1. Asian American and White Graduates by IPEDS Degree Areas
As per Harvard and M.I.T.'s Exhibit 1, the chart in Cal Tech's Exhibit 1 shows the total number of White and Asian graduates for the Class of 2016. Once again, blue bars show the number of White graduates taking degrees in each IPEDS category; the light-blue bars show the number of Asian graduates. The exact numbers in each category will be shown in Cal Tech's Exhibit 3.
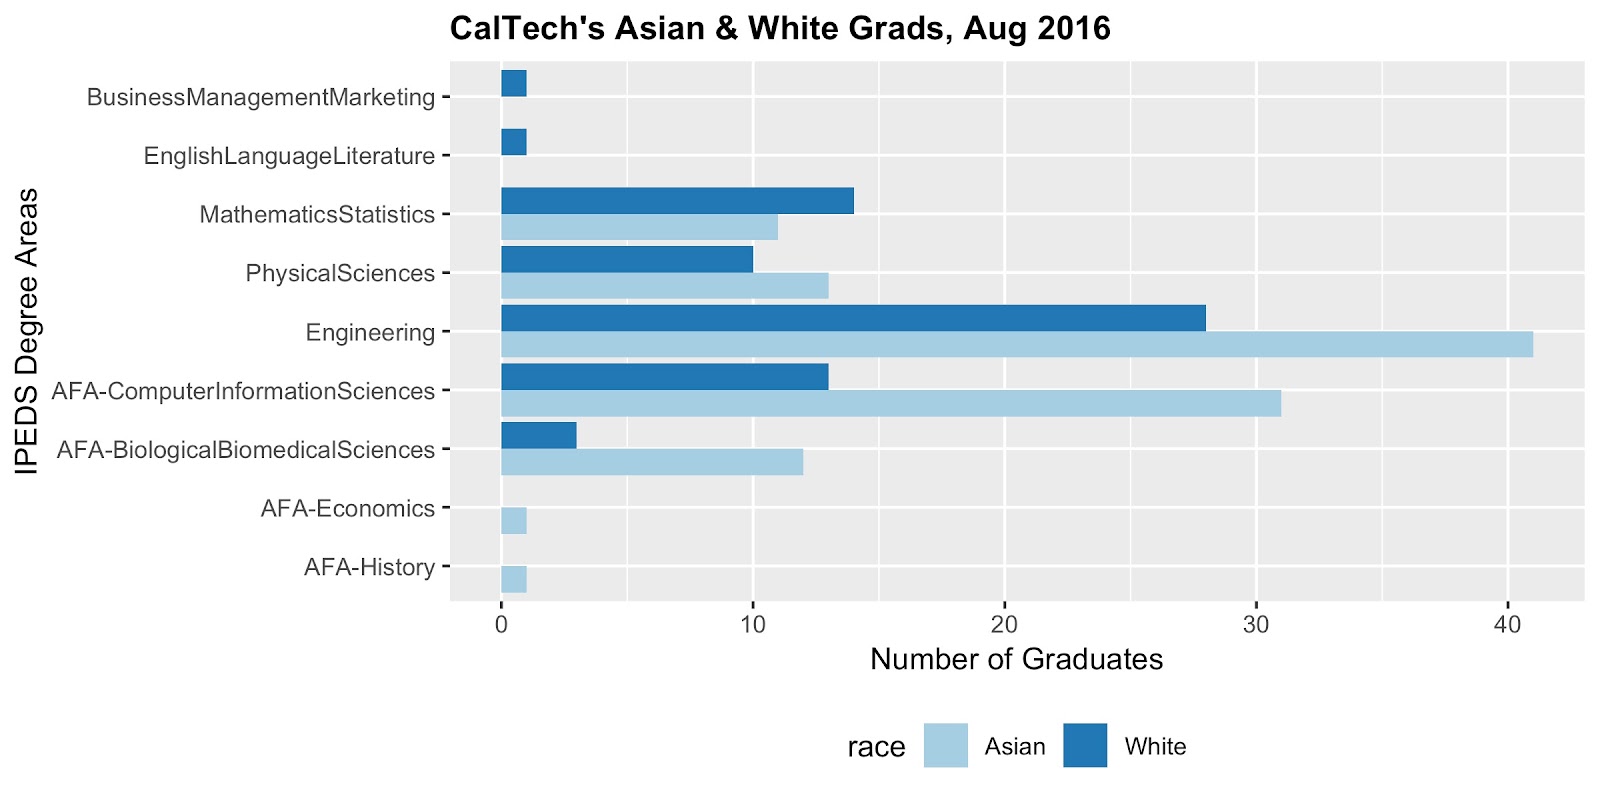
Key points:
- As at Harvard and M.I.T., "ComputerInformationSciences" and "BiologicalBiomedicalSciences" were strong Asian Focus Areas at Cal Tech. Correction: they were stronger than any focus area at the other 20 institutions covered by this report.
- The criterion for defining Asian Focus Areas implicitly assumed that White graduates would greatly outnumber Asian Graduates. Unfortunately, the criterion broke down in silly ways at Cal Tech because Cal Tech was the only institution wherein Asian American graduates outnumbered White graduates by a wide margin. Categories like "Mathematics Statistics", "Physical Sciences", and "Engineering" that were in the Asian Focus Areas at most of the other institutions discussed in this report had Asian-to-White ratios greater than 1.0 at Cal Tech; nevertheless they didn't make the cut. This point is concisely conveyed by the chart in Exhibit 2. ... :-(
Cal Tech Exhibit 2. Asian Focus Areas Identified by Overall Asian-to-White Ratio

Key points:
- The overall Asian-to-White ratio in the graduating class = 1.57, the value displayed by the dotted red line.
- The chart shows that the Asian-to-White ratios for "Computer Information Sciences" and "Biological Biomedical Sciences" are much greater than 1.57, so these categories are very strong AFAs.
- By contrast the chart also shows that the ratios for "Physical Sciences" and "Engineering" are greater than 1.0, but less than 1.57; so these areas are not AFAs, strictly speaking.
- "Business Management Marketing" and "English Language Literature" are well outside Cal Tech's AFAs because zero Asian students took degrees in those areas
Cal Tech Exhibit 3A. Graduates -- All Races
The table in Exhibit 3 displays the number of students in each racial category for each of Cal Tech's 9 degree areas. The right-most column displays the ratio of the number in the Asian column to the number in the White column for each category. The last three rows of the table show the total number of students in the Asian Focus areas, the total number in all areas, and the percentage of students in the Asian Focus Areas, respectively.
| DegreeAreas | All | White | Asian | Hispanic | Black | A2W |
|---|---|---|---|---|---|---|
| EnglishLanguageLiterature | 1 | 1 | 0 | 0 | 0 | 0.00 |
| BusinessManagementMarketing | 1 | 1 | 0 | 0 | 0 | 0.00 |
| MathematicsStatistics | 35 | 14 | 11 | 6 | 2 | 0.79 |
| PhysicalSciences | 44 | 10 | 13 | 5 | 0 | 1.30 |
| Engineering | 92 | 28 | 41 | 10 | 1 | 1.46 |
| AFA-ComputerInformationSciences | 56 | 13 | 31 | 3 | 2 | 2.38 |
| AFA-BiologicalBiomedicalSciences | 18 | 3 | 12 | 2 | 0 | 4.00 |
| AFA-History | 1 | 0 | 1 | 0 | 0 | Inf |
| AFA-Economics | 1 | 0 | 1 | 0 | 0 | Inf |
| ...SumClassOf2016... | 249 | 70 | 110 | 26 | 5 | 1.57 |
| ...PercentClassOf2016... | 100 | 28 | 44 | 10 | 2 | 1.57 |
| ...SumAsianFocusAreas... | 76 | 16 | 45 | 5 | 2 | 2.81 |
| ...PercentAsianFocus... | 31 | 23 | 41 | 19 | 40 | 1.78 |
Key points:
- Exactly one Asian student and no White students took degrees in "Economics" and "History", thereby yielding 1/0 = infinite Asian-to-White ratios for those areas, thereby making "Economics" and "History" Asian Focus Areas. Nonsense. One student is, at best, an anecdote, not a focus.
- Nevertheless, all silliness aside, the numbers and percentages displayed in Exhibits 1 , 2, and 3 should should convince the reader that Cal Tech is an academic haven for most Asian students. It is one of the two institutions covered by this report wherein it might be reasonable to assume that there really is only one pool of qualified applicants, M.I.T. being the other.
- That Asian graduates outnumbered White graduates at Cal Tech is not surprising given its location in California which has one of the largest Asian populations in the U.S. However a more important pair of factors is Cal Tech's small size and its very high 770 score for the 25th percentile on the math SAT (and, presumably, on other objective measures requiring similar skills.)
- A recent study by the Brookings Institute reported that for the Class of 2019, "We estimate that in the entire country last year at most 2,200 black and 4,900 Latino test-takers scored above a 700. In comparison, roughly 48,000 whites and 52,800 Asians scored that high. The same absolute disparity persists among the highest scorers: 16,000 whites and 29,570 Asians scored above a 750, compared to only at most 1,000 blacks and 2,400 Latinos."
Cal Tech Exhibit 3B. Graduates -- -- Other Components
Abbreviated column headings have the usual meanings:
- The "Others" category includes AmericanIndians/AlaskaNatives and NativeHawaiians/Other Pacific Islanders
- "TwoOrMore" = multiracial students
- "Unknown" = students who did not specify any racial group
- "NonResAlien" = non-resident aliens, i.e., foreign students.
| DegreeAreas | All | Others | TwoOrMore | Unknown | NonResAlien |
|---|---|---|---|---|---|
| EnglishLanguageLiterature | 1 | 0 | 0 | 0 | 0 |
| BusinessManagementMarketing | 1 | 0 | 0 | 0 | 0 |
| MathematicsStatistics | 35 | 0 | 0 | 0 | 2 |
| PhysicalSciences | 44 | 0 | 7 | 0 | 9 |
| Engineering | 92 | 1 | 5 | 0 | 6 |
| AFA-ComputerInformationSciences | 56 | 0 | 3 | 0 | 4 |
| AFA-BiologicalBiomedicalSciences | 18 | 0 | 1 | 0 | 0 |
| AFA-History | 1 | 0 | 0 | 0 | 0 |
| AFA-Economics | 1 | 0 | 0 | 0 | 0 |
| ...SumClassOf2016... | 249 | 1 | 16 | 0 | 21 |
| ...PercentClassOf2016... | 100 | 0 | 6 | 0 | 8 |
| ...SumAsianFocusAreas... | 76 | 0 | 4 | 0 | 4 |
| ...PercentAsianFocus... | 31 | 0 | 25 | NaN | 19 |
Key Points:
- The "NAN" in the last row of "Unknown" graduates occurred because there were zero Unknown graduates and zero Unknown graduates in Cal Tech's Asian Focus. So the percentage = 0 / 0 which is not a number, i.e., NAN
E. The advocates' challenge to Harvard's admissions
This section develops a plausible estimate of the increase in the Asian American share of Harvard's enrollment if admissions decisions no longer considered race as a factor.
Initial upper bound = 46.1 percent
As noted earlier, Cal Tech provides an ideal academic environment for most Asian Americans, given their focus on the same STEM areas no matter where they enroll. Indeed, Cal Tech is the one of the two technical institutions covered by this report whose strong STEM focus makes it plausible to assume that there is only one pool of qualified applicants; the other technical institute, M.I.T., is the other exception.
Beyond this, Cal Tech is also the most selective of all 21 institutions, having the highest math 25th percentile SAT score = 770. It's small enough for Asian students to greatly outnumber White students. And it has no race-based admissions; Cal Tech only provides admissions advantages based on financial need. In short, Cal Tech is as good as it gets for most Asian American students seeking to enroll in highly selective institutions. Given that 73 percent of Asian American students only obtain degrees from programs in only 7 out of Harvard's 18 degree areas, areas that only enroll half of Harvard's students, it is difficult to imagine how the Asian American share of enrollments at Harvard could come anywhere near the 46.1% Asian American share at Cal Tech. (See the table in "E. All Institutions Exhibit 1B").
But before proceeding, let's dispatch one of the advocates' more lurid headline grabbing allegations: their claim that Harvard held Asian applicants to higher standards than it held other applicants, specifically Black applicants.
- Roughly half of Harvard's Class of 2016, specifically 52%, obtained degrees in Asian Focus Areas. (See the second column in the bottom row of the table in Harvard Exhibit 3A.) The reader will recall that a fundamental assumption of this report's methodology has been that the freshmen in the entering Class of 2019 intended to pursue the same kinds of programs and in roughly the same proportions as the graduating seniors in the Class of 2016.
- We should expect that Harvard held Asian admits who pursued Asian Focus programs to higher standards than it held admits in the other half of the entering class who pursued programs outside of its Asian Focus, including the Black admits to those outside programs.
- The only question on the table at this point is whether Harvard held its Black, Hispanic, and other minority admits who pursued programs within its Asian Focus Areas to the higher standards to which it held its Asian and White admits to those programs.
Plausible Upper Bound = 22% percent
For the remainder of this discussion, it will be useful to think of Harvard as having two divisions: a STEM-oriented division akin to M.I.T., and another division that does not focus on STEM. The STEM division, called "Harvard Tech", includes the programs in Harvard's seven Asian Focus Areas; the other division includes the programs in Harvard's other eleven IPEDS areas. Both divisions enrolled about the same number of students.
Given that Asian enrollments in the non-STEM division are such a small percentage of all Asian enrollments, the advocates can't can claim that Black or Hispanic enrollments in the other division displaced substantial numbers of qualified Asian applicants. Accordingly, the rest of this discussion focuses on enrollments in Harvard Tech.
M.I.T. was more selective than the real Harvard: its 750 score for its 25th percentile on the math SAT was much higher than Harvard's 700. What percentile should we assume that Harvard's admissions office maintained for Harvard Tech? Logically it would have to be far more selective than 700 in order to make Harvard Tech a viable competitor for its Cambridge neighbor. It would have to admit students to Harvard Tech in a manner that yielded a 25th percentile that was at least 750. Of course, the higher the cutoff, the fewer the number of qualified Black and Hispanic candidates -- as per the Brookings report cited earlier.
The first row of the following table displays the number of graduates at M.I.T. Tech for all groups except Whites and Asians; the second row contains the relative percentages for each group of graduates. The third row contains the number of Harvard Tech graduates for all groups except Whites and Asians, i.e., the number of Harvard graduates who obtained degrees in Asian Focus Area; the fourth row displays the relative percentages of these graduates.
Abbreviated column headings have their usual meanings:
- The "Others" category includes AmericanIndians/AlaskaNatives and NativeHawaiians/Other Pacific Islanders
- "TwoOrMore" = multiracial students
- "Unknown" = students who did not specify any racial group
- "NonResAlien" = non-resident aliens, i.e., foreign students.
| Institution | All | Hispanic | Black | TwoOrMore | Unknown | NonResAlien | Others |
|---|---|---|---|---|---|---|---|
| M.I.T. | 1111 | 164 | 64 | 53 | 20 | 114 | 0 |
| M.I.T. % | 100 | 15 | 6 | 5 | 2 | 10 | 0 |
| Harvard Tech | 936 | 68 | 59 | 58 | 12 | 110 | 1 |
| Harvard Tech % | 100 | 7 | 6 | 6 | 1 | 12 | 0 |
Key points:
- The similarity of the percentages of M.I.T. and Harvard Tech in just about all categories is consistent with an assumption that the Harvard admissions office was admitting students to Harvard Tech who met higher objective criteria than Harvard University as a whole. Although this report has repeatedly referred to the 25th percentile on math SATs, it should be understood that objective criteria would also have included all of the other scores that ambitious, talented STEM-oriented high school students achieve, e.g., GPAs close to 4.0, high scores on Advanced Placement courses in calculus, computer science, physics, chemistry, etc, etc, etc.
- That M.I.T. and Harvard Tech did not recruit higher percentages of qualified Black and Hispanic students reflects the limited supply of qualified Black and Hispanic candidates noted by the Brookings report. Only 2,400 Hispanic and 1,000 Black students scored over 750 on the math SAT, i.e., about 2.4 times as many Hispanic as Black
- The 15% Hispanic percentage at M.I.T. was 2.5 times as high as the 6% for its Black students, consistent with Brookings. Given that Black students represented 6% of the graduates at Harvard Tech (the same as the Black 6% share of the entire Class of 2019), one would have expected that Hispanic students would have represented about 15% of its graduates. Instead, Harvard Tech's 7% Hispanic share is about 8% lower than expected.
- Given that Harvard Tech graduated about half of Harvard University's graduates, the Hispanic shortfall of 8% in Harvard Tech would translate to a 4% shortfall for the university as a whole. The four point boost would have raised the Hispanic share of the Class of 2019 from 9% to 13%.
- Now assume affirmative action was abolished across the board, i.e., at Harvard Tech and at the other half of the university. If we assumed that Harvard University then awarded admission advantages for financial need like Cal Tech, we should expect that Black and Hispanic shares of the entire Class of 2019 would look like their shares at Cal Tech, i.e., 10% and 2%, respectively. Ironically, this would still represent a boost for the Hispanic share, this time from 9% to 10%.
- On the other hand, the Black share of the entire Class of 2016 would plummet from its current 6 percent share of the entire class down to 2%, a 4% loss. The class size would remain the same if 1% of the Black loss was transferred to Hispanic students and 3% was transferred to Asian students. This would boost the Asian share of the class from 19% to 22%.
Sidebar #2 ... Harvard doesn't like Asian Americans
Before proceeding to the report's conclusions, let's take a another break, this time to consider the advocate's allegation that Harvard assigned lower personality ratings to Asian applicants than to other applicants, the gap being widest between the ratings assigned to Asian applicants and the ratings assigned to Black applicants. For the sake of argument, let's assume that these discrepancies really exist.
- Although different people develop different aspects of their personalities at different paces and achieve a balance at earlier or later points in their lives, the imbalance may be greatest during adolescence. Perhaps the best known contrasts occur between young folk who invest the time and effort required to hone their athletic skills to championship levels vs. those who invest the time and effort required to hone their academic skills to prize winning levels. So we have "high school jocks" vs. "high school nerds".
- Of course the problem with stereotypes is that they encourage misperceptions, as in, assuming that all nerds are physically or socially inept ... or that all jocks are jerks. At Harvard and at other top tier institutions, one is likely to encounter many exceptions, e.g., the whip-smart jock who "only" scored 710 on his or her math SAT or the physically adept nerd who can run three miles in less than 18 minutes.
- When it comes to personality and social development, the smart jock gets more learning opportunities than the adept nerd, opportunities such as frequent interactions with their teammates, with the members of other teams, with their schoolmate "fans", with their school's administrators, and with the press. Of particular interest to ambitious institutions like Harvard that want to produce their share of the next generation of the nation's leaders, these opportunities enable smart jocks to develop leadership skills at earlier points in life.
- So one has to wonder whether significant gaps in personality ratings would have been observed had the advocates only compared the Asian nerds in Harvard Tech with the White nerds, Hispanic nerds, and Black nerds in Harvard Tech, but made no comparisons with students in Harvard's other division.
Analysis of the data for Harvard and for twenty other top tier universities in this report leads to the following conclusions:
1. Harvard, like most top tier colleges and universities, maintains at least two pools of qualified applicants: one for applicants to STEM-oriented degree programs, another for applicants to non-STEM programs
2. Asian Americans tend to focus on the narrow subset of STEM oriented degree programs offered by Harvard and by most of the other top tier colleges and universities
3. In Harvard's case, this self-imposed limitation results in almost 75 percent of Asian American students being in enrolled in STEM programs that only account for 50 percent of the university's total enrollment.
4. In Harvard's case, this self-limitation means that Asian Americans would only obtain a modest 3 percent increase in their share of Harvard's enrollment if Harvard replaced race-conscious admissions with admissions based on financial need while maintaining its other admissions advantages, e.g., for legacies and athletes.
5. Harvard did not just hold Asian applicants to higher standards; it held all applicants to its STEM oriented programs to higher objective standards than applicants to its non-STEM programs
6. There is reason to doubt that Harvard provided Asian applicants with lower personality ratings than non-Asians.
Harvard's first trial in Boston (October/November 2018) differed from previous affirmative action cases in that the Asian advocates did not ask any of their clients, the plaintiffs who had been damaged by Harvard's admissions policies, to testify. One of Harvard's attorneys highlighted this anomaly with some theatrics. According to the Chronicle of Higher Education, he declared that his next slide would show some of the plaintiffs ... but the slide was blank.
Harvard's attorney left figuring out why the advocates had not arranged for any of their clients to testify as an exercise for the reader, but the data presented in this report favors a particular explanation ==> There was no testimony because none of the clients of the Asian advocates had been damaged by Harvard's rejections.
Nowadays it's easy for students to apply to three or more colleges by using the Common Application form. Students may have a first or second preference, but each college that receives a copy of the application treats the application as though it were the only college to which the student had applied. One can assume that the unseen plaintiffs represented by the advocates were top tier students with the highest SATs, 4.0 GPAs, and highest scores on multiple Advanced Placement courses. Does anyone really believe that Harvard's rejection of any of these academic super stars would transform them into academic orphans who would never receive a college eduction? ... Or did the rejected students merely accept admissions into the best of the three or four top tier colleges and universities from which he or she received acceptance letters?
How much sympathy from a judge, an appellate panel, or the fab nine on SCOTUS would hotshot student witnesses have received if, when asked what they did after they received Harvard's rejection letters, they gave responses something like the following:
- "Harvard was my first choice, so I was heartbroken. But when I received Yale's acceptance letter a few days later, my uncle, who is a Yale alum, assured me that Yale was actually better than Harvard, so I accepted Yale's offer, and I've been very happy with my classes and my professors so far."
- "I didn't really want to go to Harvard. I only applied because I thought it would be easier to get into Harvard than M.I.T. or Cal Tech. I got into Cal Tech, my first choice, and I'm having more fun learning more great tech stuff than I imagined was possible"
Of course the point of these little scenarios is that acceptance/rejection isn't the one way street that it used to be many decades ago. For top tier students applying to top tier colleges and universities, admission has become a process of mutual acceptance. Therefore it's highly probable that none of Harvard's high quality rejects were asked to testify because they had all been admitted to other top tier colleges and universities; so none of them were damaged. But if none of the plaintiffs were damaged, why did this case get to trial?
Affirmative action that provides admissions advantages to qualified Black Americans and to other qualified minorities may be a good idea whose political time has come and is about to expire. Elections have consequences. But the nation would have been better served if its expiration came as consequence of a more credible legal challenge.
Affirmative action that provides admissions advantages to qualified Black Americans and to other qualified minorities may be a good idea whose political time has come and is about to expire. Elections have consequences. But the nation would have been better served if its expiration came as consequence of a more credible legal challenge.
Author's Postscript
In writing and editing this report I endeavored to maintain the dispassionate posture of a "data scientist" who only wanted to give voice to the facts and to do so while invoking a minimal amount of "sociological gobbledygook". This posture enabled me to recognize unexpected patterns in the data that my preconceptions might have caused me to overlook or fail to fully appreciate.
However, upon learning that I am a Black alum of one of Harvard's PhD programs, the reader should be able to guess my attitude before and after I wrote this report about the Asian advocates who organized this dubious challenge. Indeed, my reference to them as "Asian advocates" conveys my disdain for political activists who presume to speak for community groups of which they are not members. If anything, the facts at hand intensified my disdain.
On the other hand, the facts at hand enabled me to attain a better appreciation of the awesome academic achievements of Asian Americans. Eighty years ago Asian Americans were locked out of the nation's best colleges and universities by racist laws and prejudice. The Civil Rights victory in the Supreme Court's Brown vs. the Board of Education (1954) decision enabled them to enroll. The Civil Rights legislative victories (1964, 1965) enabled them to become members of the faculty of these institutions. Asian American professors then served as role models whose presence on top tier campuses accelerated the enrollment of larger and larger numbers of Asian American students. Today, within the degree categories that this report has identified as Asian Focus Areas, Asian American enrollments at the nation's premiere colleges and universities range from prominent to dominant. Truly impressive achievements.
Were it not for the Asian advocates' divisive politics, this achievement might also be a cause for celebration by Black Americans and as inspiration for us to intensify our own efforts as Black Americans to attain higher levels of academic achievement. The judicial and legislative Civil Rights victories that made Asian American academic success a possibility were spearheaded by Black Americans. Indeed, the opportunities they provided were our gifts to all Americans.
It's clear that neoconservatives have the same strategic objectives with regards to Black higher education as their conservative predecessors. Nevertheless, we must not conflate their cynical manipulations with the honest efforts of dedicated Asian American parents to secure the best opportunities for their children.
___________________
Related notes on this blog:
Related notes on this blog:
- Black enrollments at selective U.S. colleges and universities ... October 2018
- Affirmative action at America's top tier private colleges and universities -- June 2018
APPENDIX #1 -- Links to Exhibits for Enrollments and Asian Focus Areas for 21 Top Tier U.S. Colleges and Universities
- Enrollments for Class of 2019 -- Entered in Fall 2015
- Exhibits for 21 Institutions
Amherst Brown CalTech CarnegieM Columbia
Cornell Dartmouth Duke Harvard IllinoisUC
MIT Northwestern NotreDame Penn PrincetonRice Stanford Tufts Vanderbilt Washington
Yale
APPENDIX #2-- How to obtain the IPEDS data for this report
1) Guest_782418518191
11/23/18 ... 30 days
2) Guest_17691924280
11/23/18 ... 30 days
2) Guest_17691924280
11/25/18 ... 30 days
The tables in this report are based on data obtained from the IPEDS database of the U.S. Dept. of Education's National Center for Education Statistics. Readers who are interested in obtaining the IPEDS data from which the tables in this report were derived can do so via the following procedures. They should begin by creating a master folder/directory on their computers called "AFFIRMATIVE-ACTION-LEGAL-CHALLENGE".
The number of variables required by this report is larger than the maximum number that IPEDS will deliver in one download; so two downloads are required. The first delivers the data for specified racial categories; the second delivers the data for the components of the residual "others" category
IPEDS Data -- Enrollment and graduation data in first download
- Direct your browser to the IPEDS Use The Data page
- Click "Shortcuts", then click "Select your shortcut"
- From the drop-down menu select "Previously saved IPEDS data session"
- When the next page is loaded, enter Guest_782418518191 in the "Job number" field. This access number will be in effect for thirty days beginning 11/23/18
- Click "Continue" to display the selected institutions and variables
- Click "Continue" again to obtain the data download page
- Select "Download in comma separated format", then click "Continue"
- Specify the directory/folder and filename for your data.
Now follow these same for the second download, but use Guest_17691924280
Readers who intend to use the R scripts linked to APPENDIX #3 to generate the tables that appear in this report should name the first download file "IPEDS-raw.csv" and place it in their AFFIRMATIVE-ACTION-LEGAL-CHALLENGE folder. They should name the second download file IPEDS-raw-others.csv and place it in the same folder.
APPENDIX #3 -- R code (re-edited 12/14/18) for the report's tables and charts ==> master1.R, master2.R, master3.R, and master4.R
Note 1: Please read the ReadMe note before running the R-scripts
Note2 : R scripts were preformatted for this blog using Source Code Formatter
Note 1: Please read the ReadMe note before running the R-scripts
Note2 : R scripts were preformatted for this blog using Source Code Formatter
No comments:
Post a Comment
Thank you!!! Your comments and suggestions will be greatly appreciated ... :-)